Johanna Drucker on the Past and Future of Digital Humanities Research

Johanna Drucker on the Past and Future of Digital Humanities Research

As part of the launch of the Project Arclight app, and the 50th anniversary of the Department of Communication Studies at Concordia University, on October 9, 2015 the Media History Research Centre hosted a talk by Johanna Drucker. Drucker is an internationally recognized scholar across a wide array of fields, such as typography, experimental poetry, and digital humanities. She currently holds the position of Breslauer Professor of Bibliographical Studies at UCLA’s Department of Information Studies. Her most recent publications include Graphesis: Visual Forms of Knowledge Production (2014), SpecLab: Digital Aesthetics and Speculative Computing (2009), and the co-authored book Digital_Humanities with Jeffrey Schnapp, Todd Presner, Peter Lunenfeld, and Anne Burdick (2012).

Drucker’s presentation was entitled “Digital Humanities: From Speculative to Skeptical,” which asked whether or not there was an intellectual future for the digital humanities. Right off the bat she hinted at an affirmative response, although she hesitated to call the digital humanities at present a field or a domain of knowledge defined by a specific core. Drucker described how she came to this realization when she was helping to establish a digital art history institute at UCLA, supported by the Getty foundation. In setting up the institute, queries concerning how the digital is going to change art history and how it will create new types of questions became the focus. These issues, however, Drucker viewed as ancillary to the work that needs to be done.

Urging us to take a critical approach to digital humanities research, Drucker raised a different set of questions, pondering: What are the claims we want to make? Where should the digital humanities sit institutionally? What are reasonable and realistic expectations for digital humanities research? “Deep skepticism,” she argued, “is essential at this point.”

Turning to a brief history of the digital humanities, Drucker reflected on the works of Roberto Busa, Lisa Gitelman, Ben Fry and many others as well as the Rossetti Archive, the Austrian Academy Corpus, the Proceedings of the Old Bailey, and the Homer Multitext. She recounted the early excitement surrounding the development of the digital humanities and explored how it achieved legitimacy in order to secure and validate the amount of energy and resources that goes into it today. She noted, though, that many early digital humanities projects were conceived without a good sense of how they could be utilized, and this limited their impact on scholarship. By contrast, with the Digging into Data Challenge, the task of setting out how to make this information useful became explicit, and certainly this has been a key driving force for Project Arclight. For Drucker, the most productive digital humanities projects provide a way into material, showing you a point of departure rather than making detailed arguments that risk reification. In short, it is not what the project states but what it allows us to ask that might be one of the most valuable contributions of digital humanities.

Drucker concluded her talk by identifying key issues she finds problematic in the digital humanities. First, she pointed out that the tools of digital humanists often originate outside the humanities, and as a result are built on different epistemological assumptions. For example, a tool constructed in the natural or social sciences may emphasize the reproducibility of results as the primary goal; yet, this contradicts with the interpretative focus of the humanities where situating findings in a specific socio-cultural and historical context is vital. Thus, in adopting such tools we are not only relying on techniques developed outside the humanities but also the assumptions embodied within the tools. Second, Drucker noted that not many in the humanities have ever taken statistics and are not necessarily proficient in statistical methods. This can become a problem when examining visualizations and network diagrams. While visualizations are informative as an interrogation tool, enabling researchers to see large patterns as well as to detect anomalies, and network diagrams have illustrative value, they are only effective if we know how to read them. Moreover, coming from business and politics, visualization techniques are often premised on factors outside of and of less importance to humanistic inquiry.

Drucker’s main concern is the unexamined epistemological biases and contradictions of adopting these digital tools. As a solution, she suggests we begin with models of knowledge intrinsic to our own work and then build platforms and tools from that base rather than co-opting platforms and tools from other fields. Thus, as digital humanists we need to engage with statistics and critical media studies, understand how to make, manipulate, and comprehend structured data, and create training opportunities for the necessary skill acquisition to undertake digital humanities research. As a closing remark, Drucker asserted that the strength of the humanities lies in its refusal to settle on a singular resolution.

As I left Drucker’s extremely informative talk, new ideas raced through my head and I began to reflect on and rethink my own preconceptions. Importantly, her presentation sparked new imaginings of what the digital humanities could look like in the future and reinforced my perception of the strength of digital tools. Throughout her talk, Drucker asserted that the usefulness of digital humanities work lies in its potential to create entry points into research that otherwise may be hidden, not in its ability to provide answers. This discussion also clarified the dangers and limitations of focusing on answers instead of entry points, notably the reification of information and knowledge. The language of “this is,” Drucker argued, is a game ender, a reification of misreading.

Another crucial distinction Drucker made was between reading and computer processing. Taking issue with the concept of distant reading, Drucker elucidated how machine processing is not reading; rather, machine processing is matching. Every act of human reading, she continued, is a misreading, and “this is our great virtue.” As evident in the articles I have written for Project Arclight and posted on this site, I have found myself intrigued by the catchy concept of distant reading. Drucker’s talk provided an opportunity to reflect on this concept and differentiate between human reading and computer processing. Overall, Drucker reminded me of the importance of remaining inquisitive, skeptical, and self-reflexive in all our scholarship.


References

Austrian Academy Corpus. Web. 19 Nov. 2015.

Burdick, Anne, Johanna Drucker, Peter Lunenfeld, Todd Presner, and Jeffrey Schnapp. Digital_Humanities. Cambridge: MIT Press, 2012.

The Complete Writings and Pictures of Dante Gabriel Rossetti: A Hypermedia Archive. 2008. Web. 19 Nov 2015.

Drucker, Johanna. Graphesis: Visual Forms of Knowledge Production. Cambridge: Harvard UP, 2014.

—. SpecLab: Digital Aesthetics and Speculative Computing. Chicago: U of Chicago P, 2009.

The Homer Multitext. 2014. Web. 19 Nov. 2015.

Old Bailey Proceedings Online. Version 7.2, March 2015. Web. 19 Nov. 2015.
 

It’s Here! The Arclight Experience

It’s Here! The Arclight Experience

The moment we have all been waiting for is finally here: the Arclight app has arrived! While I will leave descriptions of the back-end of the Arclight app to those who had a hand in its development, in this article I will describe the front-end experience, detailing my initial use and testing of the app. For more information on the development of Arclight, see Derek Long’s in-development preview and Kit Hughes’s articles on the technical method and interpretive framework of Scaled Entity Search (SES). See also, Tony Tran’s Arclight Guide and Eric Hoyt’s article on Teaching with Arclight.

It was with great pleasure that I was able to experiment with Arclight before its official launch. Entering different queries into the search box, I began to think about its potential uses for my own research. My doctoral research examines the constitution of celebrity in Canadian culture, with a special focus on Canadian literary culture. Using the celebrity phenomenon of Leonard Cohen and his multi-decade career as the object of my research, I investigate the construction of celebrity phenomena through various discourses that circulate via diverse media channels and what these discourses (and the tensions between them) can tell us about the changing constitution of celebrity in Canada since the 1960s.

As a foundation to my study of discourses of celebrity in Canada, I am interested in the history of the term “celebrity” within the United States and Canada. For this investigation, Arclight and the Media History Digital Library (MHDL) could be an effective tool in helping me locate starting points to explore its rise in popularity and to compare it with other terms such as “star.” My intent here is not to “find answers” but rather to tap into Arclight’s capacity to highlight trends at a different scale of analysis and to potentially locate points of interest that require closer examination. In this respect, Arclight and its use of SES can be employed as a method of distant reading that identifies broader patterns among texts, and in turn points towards smaller areas in which other types of analysis, including close reading, become useful.

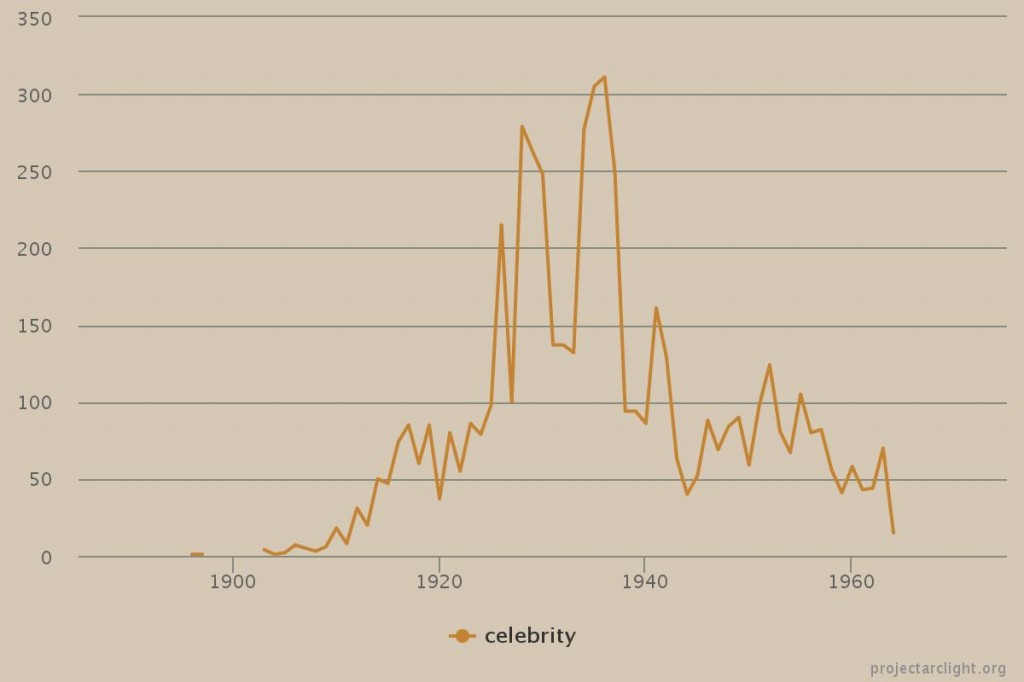
I started by typing the term “celebrity” into the query box at the top left hand of the app, and a chart similar to this one appeared on my screen (default view):


celebrity


When I hovered my mouse over different points in the chart, I could see that at its peak in 1936 the word celebrity appears on 311 pages. By contrast, in 1888, the word appears on one page. Note that these numbers refer to the amount of digitized pages in which “celebrity” occurs in a given year, not individual mentions.

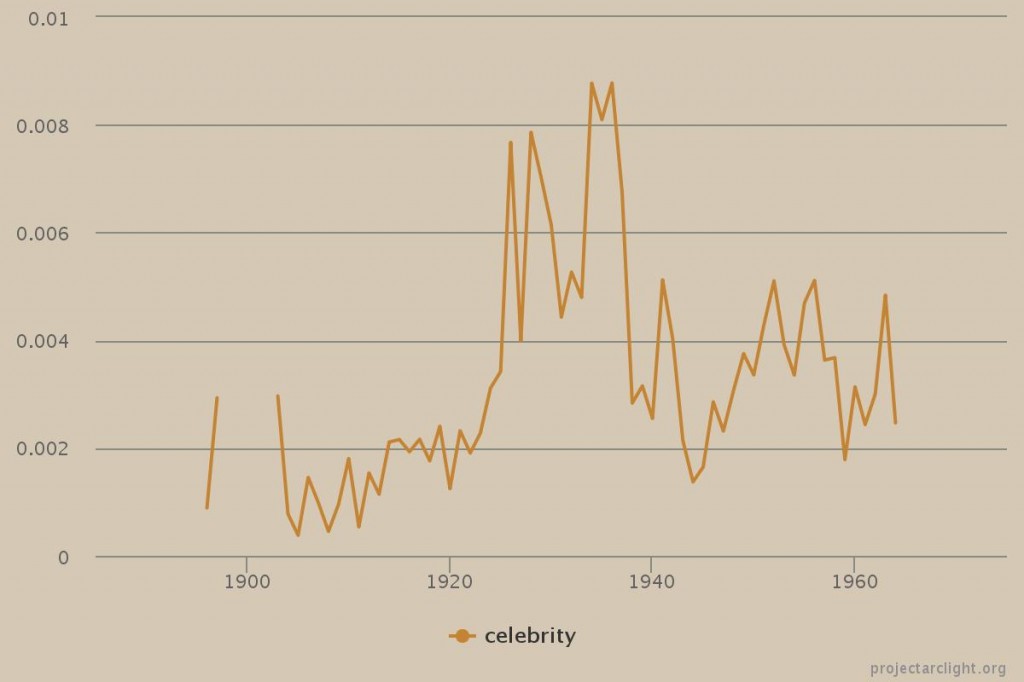
To the right of the query box is a number of options you can choose, including setting the time frame (calendar icon), filtering by journal (book icon), and changing the view from default to normalized data (percent sign). In the normalized view, instead of graphing the number of pages, the app visualizes the percentage of pages in which the term “celebrity” occurs based on the total number of digitalized pages from that year. It looks like this:


celebrity normalized


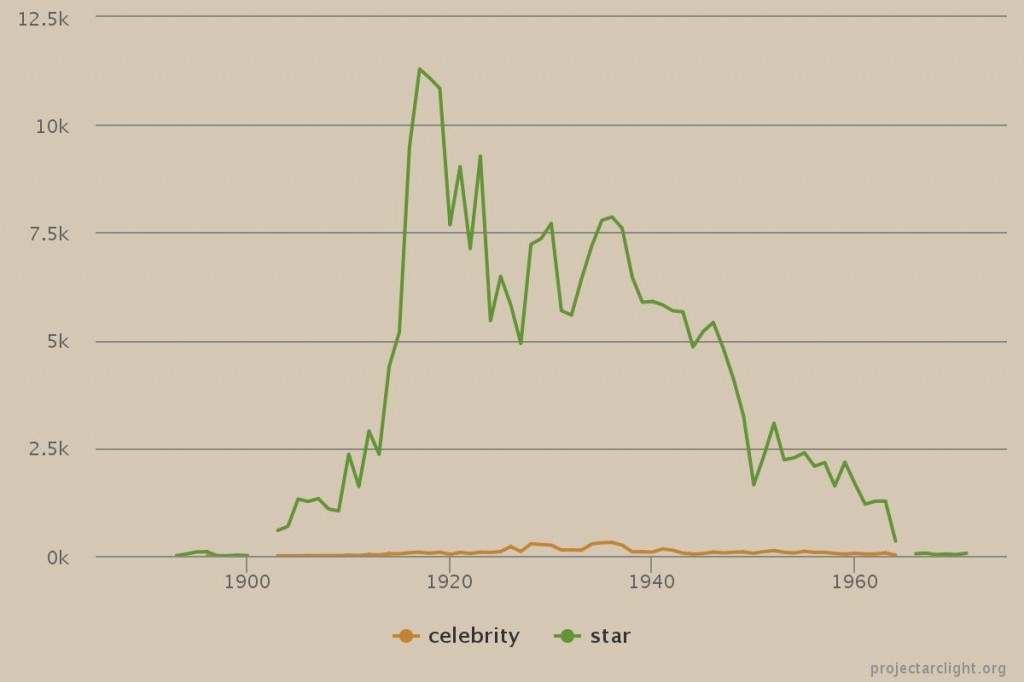
It is important to note that you can filter by journal; however, I chose to search all the digitized pages of the MHDL for this demonstration. I was also curious how the term “celebrity” stacks up against the term “star.” In order to graph multiple queries at once, all you have to do is type another term into the search box and it graphs both terms.


celebrity star default


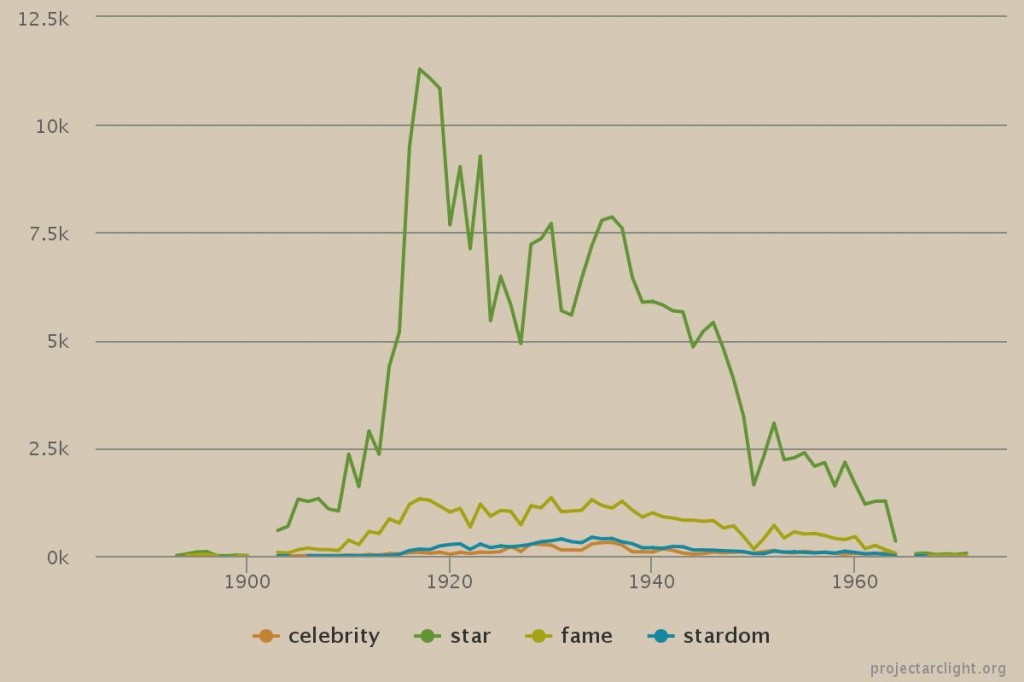
To reiterate, Arclight is a great tool to discover new areas in which to dig deeper, to generate new questions, and to take a step back and consider and explore different scales of analysis. Thus, I am not using Arclight to find solutions but to look at particular issues from a different perspective. As Eric Hoyt emphasizes in “Teaching with Arclight and Poe”: “The line graphs in Arclight are not arguments. They are simply visualizations of how many MHDL pages a given term appears in per year.” The chart above shows how the terms “celebrity” and “star” both trend across the MHDL. However, I cannot take this chart to generalize and argue that “celebrity” was not a commonly used term until recently, or that the preferred term to refer to a famous person was “star.” In the context of the MHDL, the term “celebrity” was not used as often as the term “star.” In order to understand what this means exactly, it is important to shift the scale of analysis and undertake a close reading of the search term in context at a particular point in time. Further, at this scale of analysis, it is very hard to differentiate between false and positive results. To zoom in and examine how the search terms appear in context, you can click at any point in the graph. The page will then redirect you to a list of all the search hits in Lantern, which you can read within the context of the journal. This feature became very useful as I undertook a second set of experimental searches. Before I proceed further, I want to add one more graph where I used four search terms:


celebrity star fame stardom default


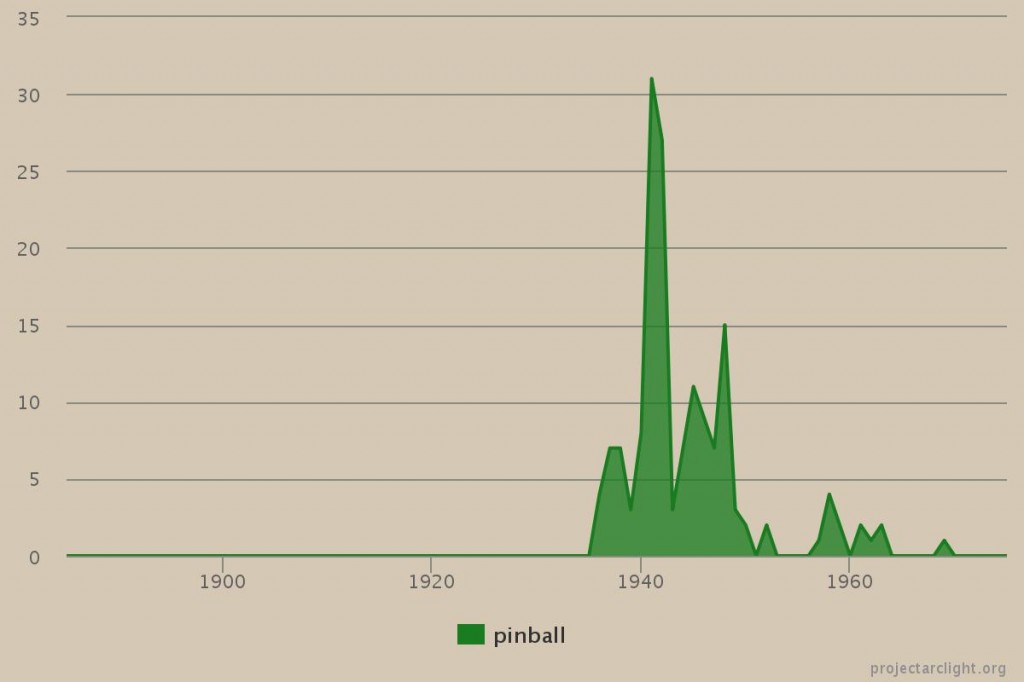
My second search topic relates to a side project and passion of mine: pinball. Since pinball and cinema have a long and intertwined history, I was curious to see how often “pinball” appears in the digitized pages of the MHDL as well as the contexts in which it is referenced.


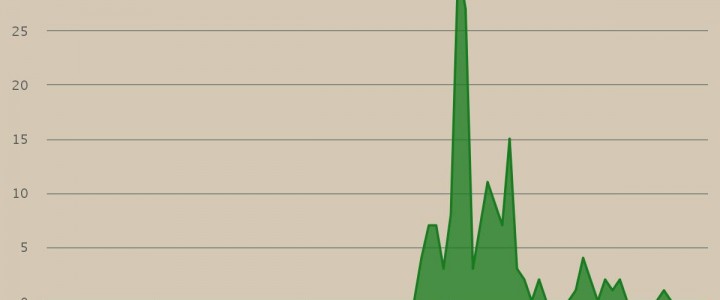
pinball stacked


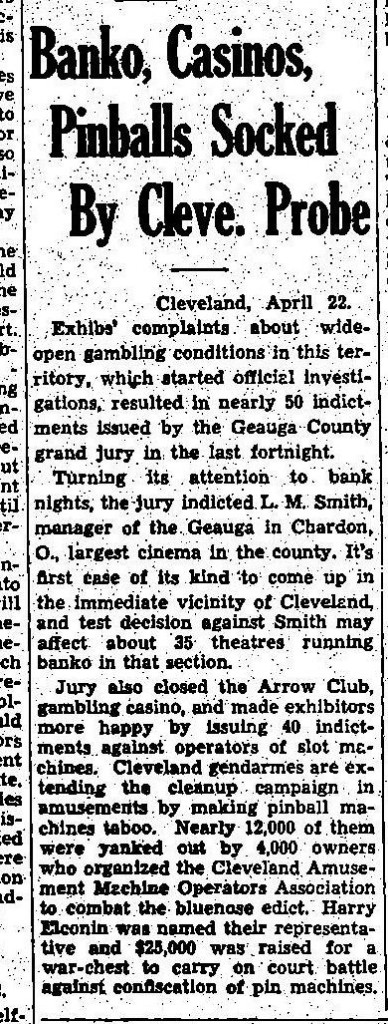
This chart (default, stacked view) shows no mention of pinball in the MHDL until 1936 (4 pages) and that it peaks in 1941(31 pages), dropping off again in the late 1940s. If I want to understand why mentions of pinball peak in 1941 and the contexts in which it occurs, I can begin by clicking on the year of interest. This takes me to Lantern, which lists all the entries in which my search term, pinball, appears. I can then carefully read the page in context. Inspecting the entries for 1941, I discovered letters to the editors about pinball, advertisements utilizing pinball as a means to attract attention, and importantly, many articles regarding the increasing regulation of pinball, including new fees and the outright banning of pinball. As someone intrigued with the history of pinball and the existence of outdated by-laws that continue to be enforced in the United States and Canada (including Montreal), this Arclight search proved very fruitful for me. It allowed me to locate particular areas and time frames in which to focus my research into pinball’s legal history.


broadcasting21unse_0529 cut


variety142-1941-04_0171 cut


Overall, I found Arclight very intuitive and easy to use, and not to mention fun. But enough about my searches, go try it for yourself!

#arclight2015 in Brief: Twitter

#arclight2015 in Brief: Twitter

The final day of the Arclight Symposium ended with a roundtable discussion on media history and digital methods. One suggestion emerging from this session was that we should share our research more widely, utilizing the platforms we frequently access, such as Twitter, Facebook, and Tumblr. This idea of using the everyday digital tools that surround us is also addressed in the article “Getting Started in the Digital Humanities,” posted on the Digital Scholarship in the Humanities website. This article advises to “follow & interact with DH folks on Twitter,” emphasizing how it can be an effective tool for creating networks and keeping up-to-date on research and events in this community.

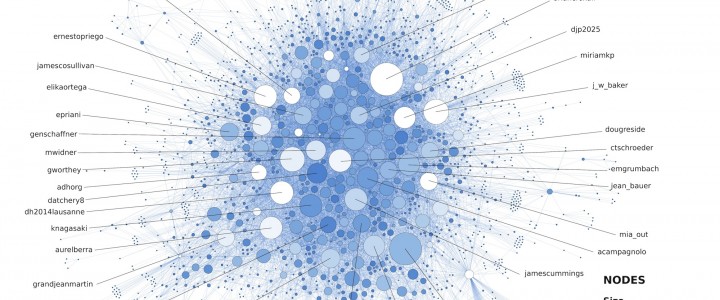
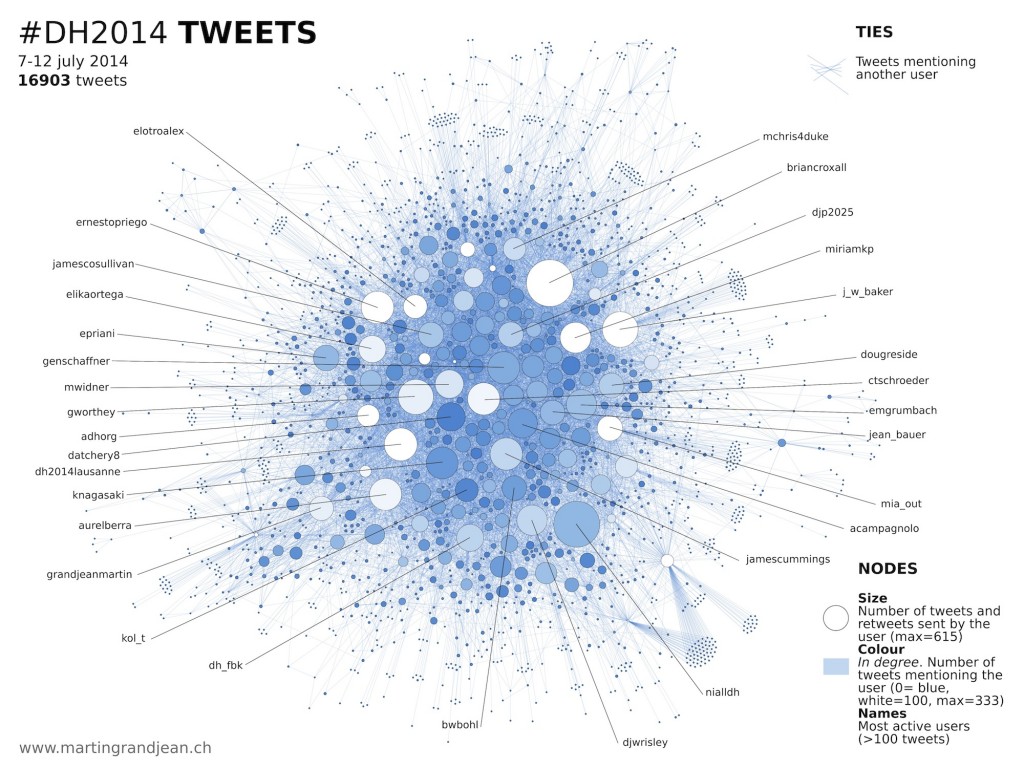
On his website Martin Grandjean notes the growing use of Twitter at digital humanities events, claiming that “the public of the lectures is at least as much present on Twitter than physically in the room.” Using the 2014 annual international conference of the Digital Humanities as an example, he reports that approximately 2,000 people posted around 16,000 tweets, while roughly 750 were actually in attendance. Grandjean and his colleague Yannick Rochat decided to turn the data from these tweets into some stunning visualizations.


DH2014

In October 2014, Grandjean presented an article on the role of Twitter, entitled “Source Criticism in 140 Characters: Rewriting History on Social Networks,” at the International Federation for Public History Conference in Amsterdam. In April 2015, the first international and interdisciplinary conference on the use of Twitter for research was held in Lyon, France. The objective of this one-day conference was “to develop interdisciplinary awareness of the possibilities afforded by Twitter for research.” In addition to questioning how Twitter may be used for research, the conference studied Twitter “in its own right, with researchers testing whether traditional tools and theories still stand in the universe of 140 characters messages.”

Undertaking this practice myself, throughout the three days of the symposium I live-tweeted the panels, posting approximately 200 tweets to the @projarclight twitter account. Before the Arclight Symposium I did not use Twitter on a day-to-day basis and often struggled to find its use and place in my academic and personal life beyond retweeting an interesting link or something relevant to my research. However, my perception of Twitter changed when I experienced first-hand the process of live-tweeting an event.

Having never live-tweeted an event before, I quickly learned the value of Twitter in an event setting. Paying close and careful attention to the presentations, I summarized the presenters’ arguments in 140-character tweets. Not only did tweeting provide a useful tool for updating others who were not present, but it also facilitated discussion on Twitter. I became acutely aware of the latter as participants in the room were concurrently tweeting their own responses to the presentations, as conversations were developing, and as we started re-tweeting one another. This became another instance where the digital began to re-shape our experience, in turn creating an opportunity to consider how we can both utilize the digital and reflect on the impact the digital has on us.

In the months since the Arclight Symposium I have continued to employ live-tweeting as an important part of my academic conference involvement. I have discovered the ways in which live-tweeting has the ability to alter experiences of presence and participation in academic conference settings. To me, using Twitter is akin to adding an extra layer of conversation, contemplation, and circulation to my experience of listening to presenters describe their ideas and arguments; it turns active listening into a social experience. Rather than listening and making notes for my own personal use, I condense my notes into bite-size pieces of information to share on social media. As I mentioned earlier, Twitter not only enables individuals who are not at the event to get a glimpse of the emerging ideas and conversations, but it also has the potential to create conversations in its own right.

At the same time, we need to be critical and not simply celebrate Twitter for its capacity to reshape our experiences, the ways we share ideas, and how we document academic events. It is evident from Grandjean and Rochat’s visualizations that tweets produce more data, which we can analyze using a method of distant reading, but it is less clear beyond the additional data generated, what the value is exactly of each tweet. In live-tweeting the Arclight Symposium was I really adding more substance and meaning to the conversation, or was I simply adding more data, relaying ideas onto social media without contributing any analysis—analysis that Twitter and its 140-character limit essentially restricts. Although the entire structure of Twitter is based upon its short, limited posts, there are ways around its character-limit. For instance, individuals can post pictures that contain larger amounts of texts (yet, the process of live-tweeting is too instantaneous to allow the time for this), or connect multiple tweets together in a “tweetstorm” (Koh). Twitter however is beginning to recognize how its form may hinder meaningful discourse; for example, it is now considering an expansion of its character limit, perhaps by way of a paid option, with its recent announcement of “140 Plus” (Koh). To reinforce a point from my last article, with the growing use of Twitter among digital humanities scholars we need to contemplate what these instantaneous, short forms of writing might also mean for scholarship and the ways in which we reach audiences.

This discussion of Twitter invokes and thus provides me an opportunity to revisit and highlight some of the issues and topics that emerged at the Arclight Symposium, including:

  • The vital importance of paying attention to, rethinking, and readjusting the scale of analysis and the use of digital methods to zoom in and out of various scales of analysis;
  • The opportunities and limits of crowdsourcing and opening up the topic of research to subject experts and amateurs outside the university who are willing and interested in participating in the research process;
  • The rise of short forms of writing, such as Twitter, and the pressure it generates for both online journalists and academics to produce increasingly brief, easily consumable forms of writing, akin to that of a sound bite, in an environment where there are constant battles for the attention of readers;
  • The importance of collaboration, open-source access, and co-authorship; and
  • Digital methods as just one tool in our methodological toolkit.

In debating the functionality, effectiveness, and use of digital tools like Twitter it is essential to take into account the bigger picture and how our use of digital tools draws attention to new and different issues and questions, reaches and promotes collaboration among diverse audiences, promotes open-access, and sparks conversation and ideas that may not otherwise arise.


Works Cited

Getting Started in the Digital Humanities.” Digital Scholarship in the Humanities: Exploring the Digital Humanities 14 Oct 2011. Web. 15 July 2015.

Grandjean, Martin. “[DataViz] The Digital Humanities Network on Twitter (#DH2014).” Martin Grandjean: Digital Humanities | Data Visualization | Network Analysis 14 July 2014. Web. 14 July 2015.

—. “[Twitter Studies] Rewriting History in 140 Characters.Martin Grandjean: Digital Humanities | Data Visualization | Network Analysis 11 Oct 2014. Web. 14 July 2015.

Koh, Yoree. “Twitter Mulls Expanding Size of Tweets Past 140 Characters.” The Wall Street Journal. 29 Sept 2015. Web.

Twitter for Research – 1st International & Interdisciplinary Conference, 2015.Centre for Digital Humanities. 8 Dec 2014. Web. 15 July 2015.