 Welcome to the Arclight Guide! This guide will help you get started by introducing you to the basic functions and options Arclight offers.
Performing a Search
Performing a search in Arclight is easy and fast. In the query box in the top left corner, simply enter an query and hit enter. The resulting graph will show how your query trends across the Media History Digital Library. By moving your cursor over the data points, Arclight will tell you how many page hits your query had in that particular year. Additionally, when you click the data point, it will take you to Lantern so you can have a closer look at these specific pages.
Performing a Multiple Query Search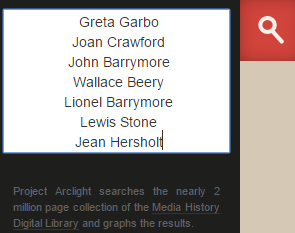
Arclight isn’t limited to one query. If I wanted to search for the cast of Grand Hotel (1932), I can take a list and copy and paste the queries into the search box and hit enter. Note that if you are using a word processor, each query on the list should be on a new line.
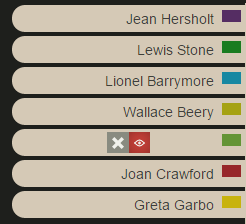
When performing searches with several queries, the results may be overwhelming. On the left side of the screen will be tabs with each query. When you move your cursor over a tab, it gives you some options. The large X removes the query from search, while Eye button toggles the visibility of the query on and off.
Setting a Year Range
 This button will allow you to set date limits on your searches. When you click this button, a tab will appear where you can enter the years you want to focus on. When the years limits are set, the graph will adjust and scale to your time period.
The Maximum Hit Guide
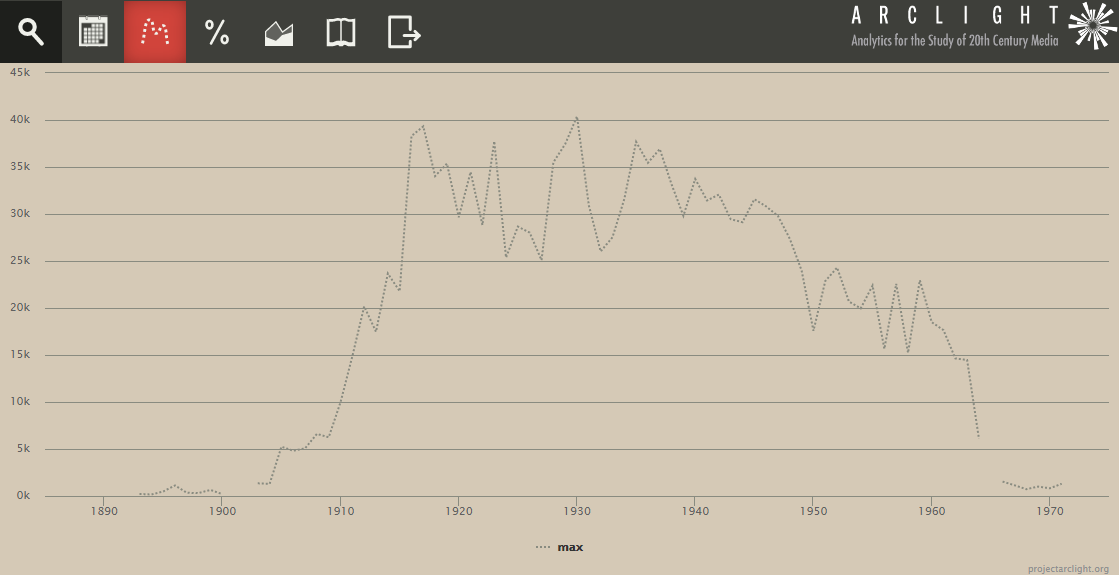
 This button will add the Maximum Hits Guideline to your graph. This guideline tells you the total number of pages the Media History Digital Library has for each year. This guideline reveals some important information, such as gaps in our corpus (e.g. 1901-1902) and years where we have the most pages. With this, we can make better interpretations of our results (see Normalizing Data below for more).
Normalizing Data
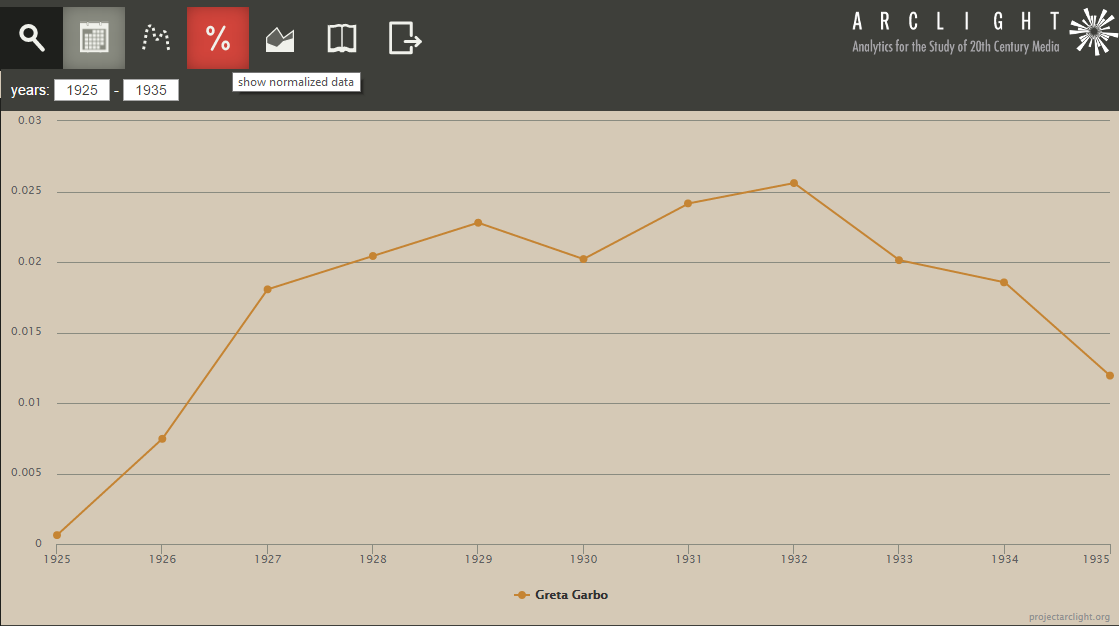
 This button will take the number of page hits of each year and divides it by the total number of pages available in that year (the Maximum Hits Guideline) to return a percentage. This is helpful because the resulting graph now shows the results on a common scale.
For example, let’s compare two graphs about Greta Garbo. This graph shows the number of pages hits per year during the time period from 1925 to 1935. Notice how Greta Garbo peaks in 1929 with over 800 page hits.
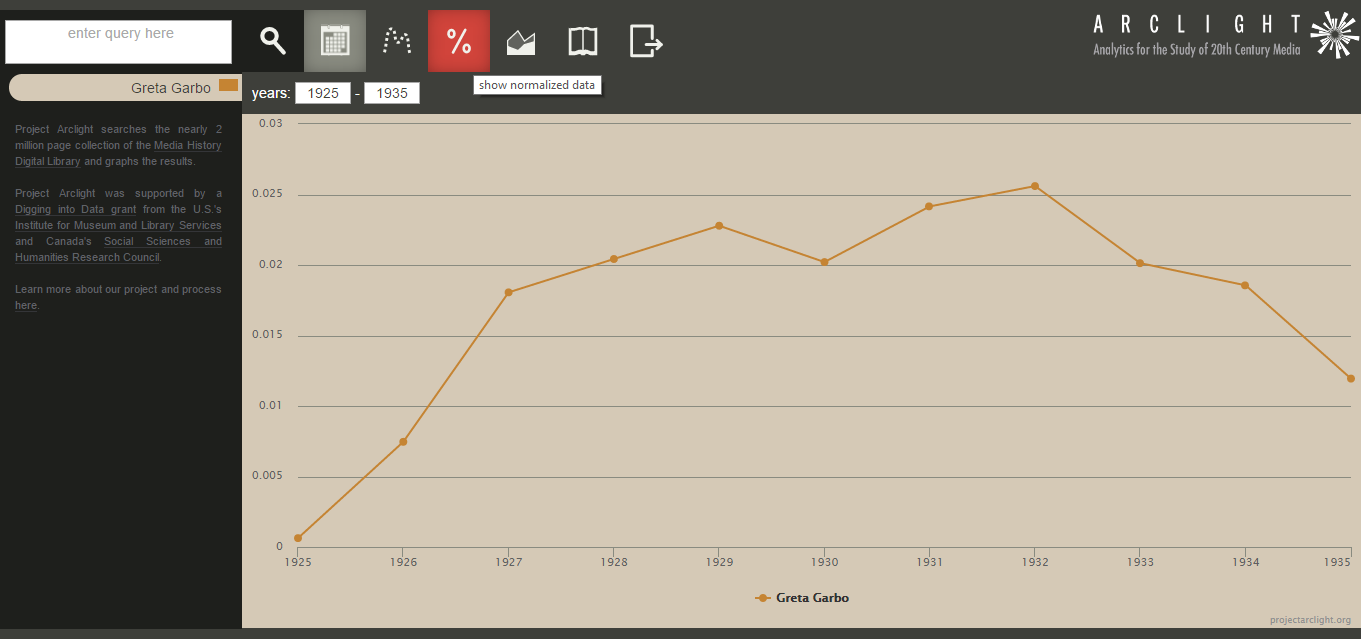
The graph below shows the same search, except the data is normalized. Instead of page hits, the graph refers to percentages. In 1929, Greta Garbo was registered in about 2.3% of the Media History Digital Library‘s pages for that year. Notice how in this graph, her results peak in 1932; while her overall page hits were relatively smaller in 1932, she was in a higher percentage of the available pages. This could be due to several reasons: increasing or waning popularity, changing marketing practices, the varying makeup of the corpus between years, and/or simple mathematical statistics as 1932 has over 10,000 fewer pages than 1929. While this warrants further investigation, the main point is that we should consider larger contexts when looking at our results and normalizing our data helps us with this.
Stack Series
 This button will allow you to combine or “stack” queries so that you can see how they trend together. Starting at the front with the last query entered, Arclight takes those numbers and adds it to the next layer behind, and repeats until it reaches the first query entered.
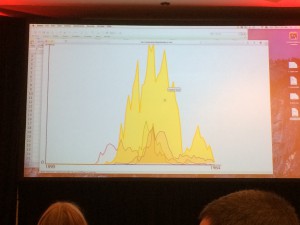
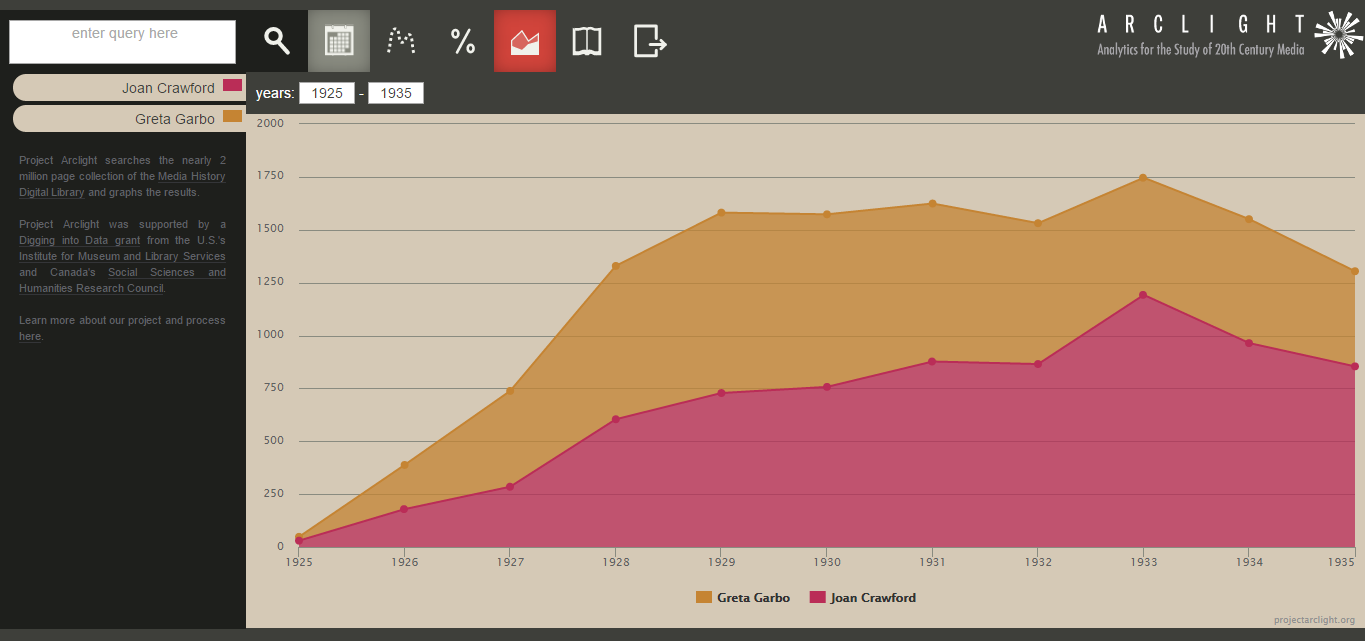
In the graph below, we have a search for Greta Garbo and Joan Crawford (in that order). In the front layer, the pink Joan Crawford, Arclight is giving her basic results. In the orange layer, Arclight is combining both numbers. In this case, Garbo and Crawford had over 1,500 combined hits in 1930.
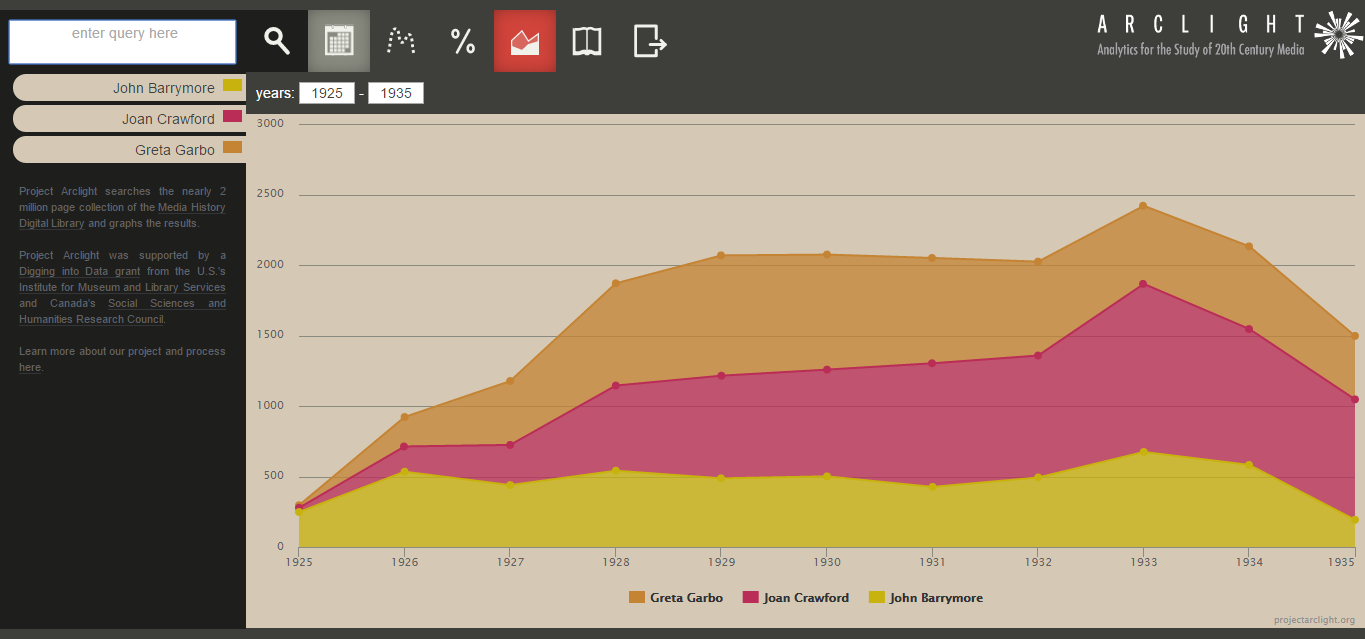
For more than two entries, the process continues until it reaches the back layer. In the graph below, Yellow is John Barrymore, Pink is Barrymore and Joan Crawford, and Orange is Barrymore, Crawford, and Greta Garbo.
Journal Filter
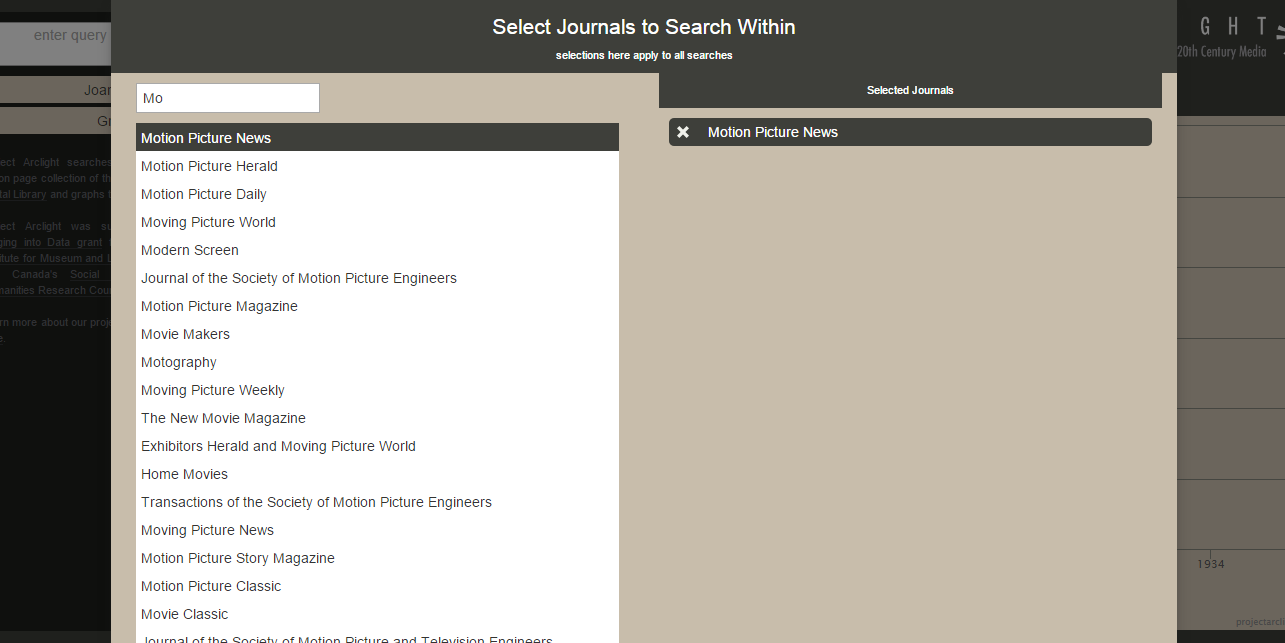
 This button allows you to limit your search to specific journals. Clicking the button will produce a menu that will allow you to search and select which journal(s) you wish to search. Once selected, the journal title will appear on the right side. You can remove journals by clicking the X next to their titles. Once you are done, click outside the menu and Arclight will automatically perform the searches.
Exporting Data
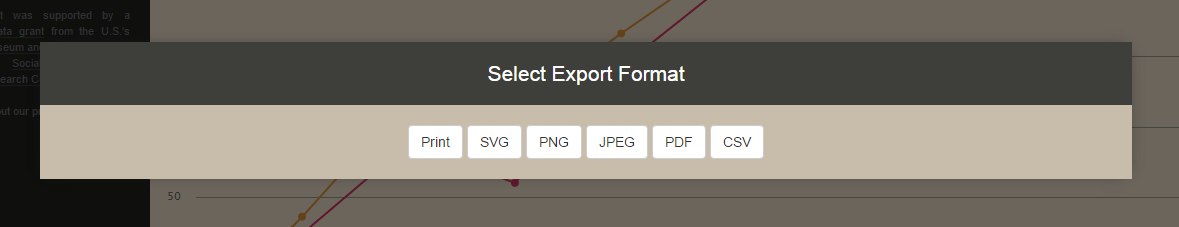
 After you have completed your searches, Arclight lets you download the graphs and data in multiple formats. Clicking this button will bring up a menu where you can select your preferred format:
We hope this Introduction Guide has been helpful and if you have any further questions, don’t hesitate to contact us here.